Typography
Text can be bold, italic, strikethrough, or inline code.
Lorem Ipsum
Dolor imperdiet nostra sapien scelerisque praesent curae metus facilisis dignissim tortor. Lacinia neque mollis nascetur neque urna velit bibendum. Himenaeos suspendisse leo varius mus risus sagittis aliquet venenatis duis nec.
Dolor cubilia nostra nunc sodales
Consectetur aliquet mauris blandit
Ipsum dis nec porttitor urna sed
| name: colors |
| ## Colors |
| .left-column[ Text color |
| Link Color |
| Bold Color |
| Italic Color |
Inline Code
] |
.right-column[
Lorem ipsum dolor sit amet, consectetur adipiscing elit (link),
sed do eiusmod tempor incididunt ut labore et dolore magna aliqua.
Erat nam at lectus urna.
Pellentesque elit ullamcorper dignissim cras tincidunt (bold) lobortis feugiat.
Eros donec ac odio tempor orci dapibus ultrices.
Id porta nibh venenatis cras sed felis eget velit aliquet.
Aliquam id diam maecenas ultricies mi.
Enim sit amet
code_color("inline")
venenatis urna cursus eget nunc scelerisque viverra.] |
Big Topic or Inverse Slides #
Slide Headings ##
Sub-slide Headings ###
Bold Call-Out ####
This is a normal paragraph text. Only use header levels 1-4.
Possible, but not recommended #####
Definitely don’t use h6 ######
Left-Column Headings
.left-column[ ## First
Second
Third
]
.right-column[ Dolor quis aptent mus a dictum ultricies egestas.
Amet egestas neque tempor fermentum proin massa!
Dolor elementum fermentum pharetra lectus arcu pulvinar. ]
| class: inverse center middle |
| # Topic Changing Interstitial |
class: inverse center middleBlockquote
This is a blockquote following a header.
When something is important enough, you do it even if the odds are not in your favor.
Code Blocks
R Code
ggplot(gapminder) +
  aes(x = gdpPercap, y = lifeExp, size = pop, color = country) +
  geom_point() +
  facet_wrap(~year)
JavaScript
var fun = function lang(l) {
  dateformat.i18n = require('./lang/' + l)
  return true;
}
More R Code
dplyr::starwars %>% dplyr::slice_sample(n = 4)cli::cli_alert_success("It worked!")## v It worked!–
message("Just a friendly message")## Just a friendly message–
warning("This could be bad...")## Warning: This could be bad...–
stop("I hope you're sitting down for this")## Error in eval(expr, envir, enclos): I hope you're sitting down for thisexclude: false
tibble::as_tibble(mtcars)## # A tibble: 32 x 11
## mpg cyl disp hp drat wt qsec vs am gear carb
## <dbl> <dbl> <dbl> <dbl> <dbl> <dbl> <dbl> <dbl> <dbl> <dbl> <dbl>
## 1 21 6 160 110 3.9 2.62 16.5 0 1 4 4
## 2 21 6 160 110 3.9 2.88 17.0 0 1 4 4
## 3 22.8 4 108 93 3.85 2.32 18.6 1 1 4 1
## 4 21.4 6 258 110 3.08 3.22 19.4 1 0 3 1
## 5 18.7 8 360 175 3.15 3.44 17.0 0 0 3 2
## 6 18.1 6 225 105 2.76 3.46 20.2 1 0 3 1
## 7 14.3 8 360 245 3.21 3.57 15.8 0 0 3 4
## 8 24.4 4 147. 62 3.69 3.19 20 1 0 4 2
## 9 22.8 4 141. 95 3.92 3.15 22.9 1 0 4 2
## 10 19.2 6 168. 123 3.92 3.44 18.3 1 0 4 4
## # ... with 22 more rowsknitr::kable(head(mtcars), format = 'html')| mpg | cyl | disp | hp | drat | wt | qsec | vs | am | gear | carb | |
|---|---|---|---|---|---|---|---|---|---|---|---|
| Mazda RX4 | 21.0 | 6 | 160 | 110 | 3.90 | 2.620 | 16.46 | 0 | 1 | 4 | 4 |
| Mazda RX4 Wag | 21.0 | 6 | 160 | 110 | 3.90 | 2.875 | 17.02 | 0 | 1 | 4 | 4 |
| Datsun 710 | 22.8 | 4 | 108 | 93 | 3.85 | 2.320 | 18.61 | 1 | 1 | 4 | 1 |
| Hornet 4 Drive | 21.4 | 6 | 258 | 110 | 3.08 | 3.215 | 19.44 | 1 | 0 | 3 | 1 |
| Hornet Sportabout | 18.7 | 8 | 360 | 175 | 3.15 | 3.440 | 17.02 | 0 | 0 | 3 | 2 |
| Valiant | 18.1 | 6 | 225 | 105 | 2.76 | 3.460 | 20.22 | 1 | 0 | 3 | 1 |
| exclude: false |
r DT::datatable(head(mtcars), fillContainer = FALSE, options = list(pageLength = 4)) |
{=html} <div id="htmlwidget-1" style="width:100%;height:auto;" class="datatables html-widget"></div> <script type="application/json" data-for="htmlwidget-1">{"x":{"filter":"none","vertical":false,"fillContainer":false,"data":[["Mazda RX4","Mazda RX4 Wag","Datsun 710","Hornet 4 Drive","Hornet Sportabout","Valiant"],[21,21,22.8,21.4,18.7,18.1],[6,6,4,6,8,6],[160,160,108,258,360,225],[110,110,93,110,175,105],[3.9,3.9,3.85,3.08,3.15,2.76],[2.62,2.875,2.32,3.215,3.44,3.46],[16.46,17.02,18.61,19.44,17.02,20.22],[0,0,1,1,0,1],[1,1,1,0,0,0],[4,4,4,3,3,3],[4,4,1,1,2,1]],"container":"<table class=\"display\">\n <thead>\n <tr>\n <th> <\/th>\n <th>mpg<\/th>\n <th>cyl<\/th>\n <th>disp<\/th>\n <th>hp<\/th>\n <th>drat<\/th>\n <th>wt<\/th>\n <th>qsec<\/th>\n <th>vs<\/th>\n <th>am<\/th>\n <th>gear<\/th>\n <th>carb<\/th>\n <\/tr>\n <\/thead>\n<\/table>","options":{"pageLength":4,"columnDefs":[{"className":"dt-right","targets":[1,2,3,4,5,6,7,8,9,10,11]},{"orderable":false,"targets":0}],"order":[],"autoWidth":false,"orderClasses":false,"lengthMenu":[4,10,25,50,100]}},"evals":[],"jsHooks":[]}</script> |
layout: true
Lists
.pull-left[ #### Here is an unordered list:
- Item foo
- Item bar
- Item baz
- Item zip ]
.pull-right[
And an ordered list:
- Item one
- Item two
- Item three
- Item four ]
And a nested list:
- level 1 item
- level 2 item
- level 2 item
- level 3 item
- level 3 item
- level 1 item
- level 2 item
- level 2 item
- level 2 item
- level 1 item
- level 2 item
- level 2 item
- level 1 item
Nesting an ol in ul in an ol
- level 1 item (ul)
- level 2 item (ol)
- level 2 item (ol)
- level 3 item (ul)
- level 3 item (ul)
- level 1 item (ul)
- level 2 item (ol)
- level 2 item (ol)
- level 3 item (ul)
- level 3 item (ul)
- level 4 item (ol)
- level 4 item (ol)
- level 3 item (ul)
- level 3 item (ul)
- level 1 item (ul)
library(ggplot2)
(g <- ggplot(mpg) + aes(hwy, cty, color = class) + geom_point())
g + xaringanthemer::theme_xaringan(text_font_size = 16, title_font_size = 18) +
  ggtitle("A Plot About Cars")
.footnote[Requires {showtext}]
layout: false
Square image

.footnote[GitHub Octocat]
Wide image
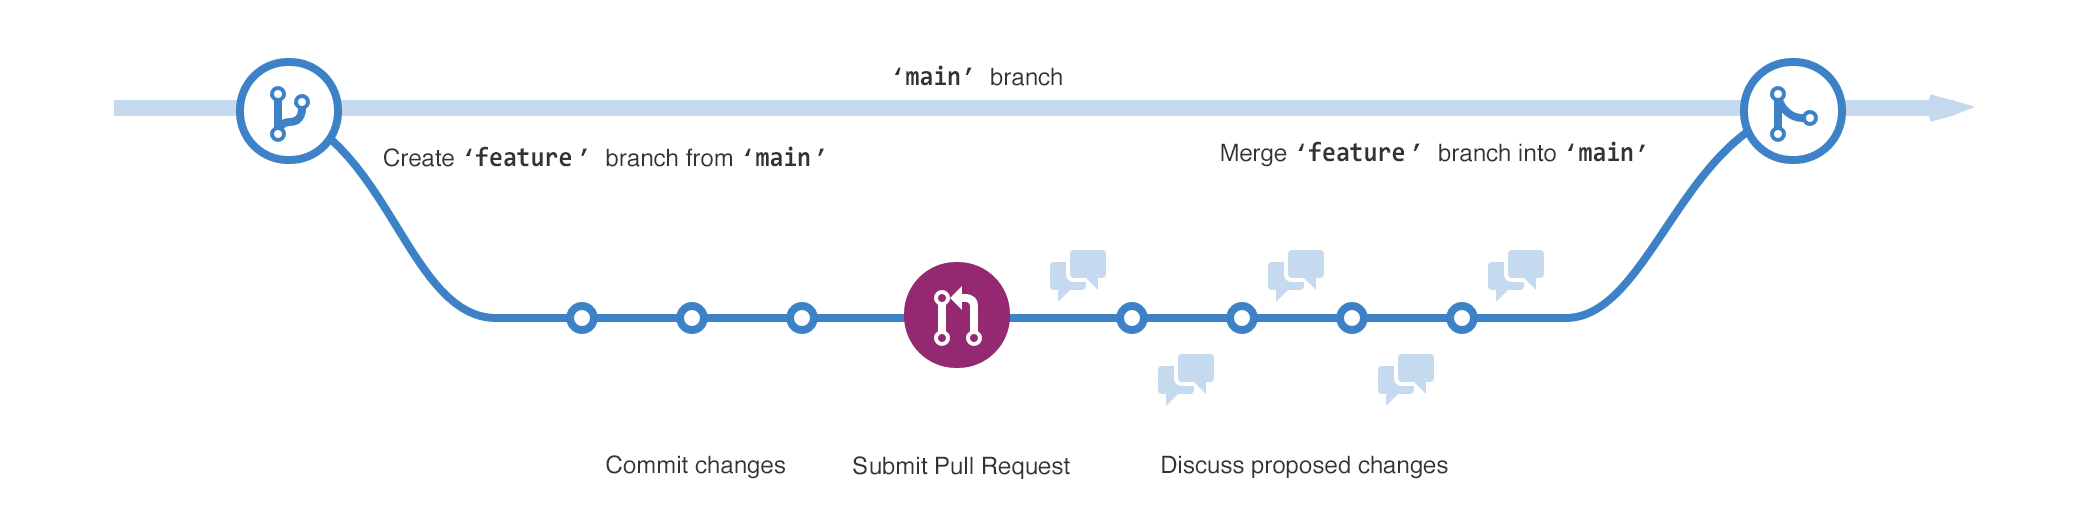
A wide image with a diagram of branching in git.
.footnote[Wide images scale to 100% slide width]
Two images
.pull-left[
 ]
]
.pull-right[
 ]
]
Definition lists can be used with HTML syntax.
- Name
- Godzilla
- Born
- 1952
- Birthplace
- Japan
- Color
- Green
class: center, middle
Thanks!
Slides created via the R packages:
xaringan
gadenbuie/xaringanthemer
The chakra comes from remark.js, knitr, and R Markdown.